International Partner Search
Innovation & Technology Offer
French Startup propose a Big Data spreadsheet with dynamic charts and easy-to-use advanced analytics solution, for a technical cooperation agreement
Country of Origin: France
Reference Number: TOFR20160805001
Publication Date: 5 August 2016
Summary
A French Startup specialised in software development has developed visual analytics software that enables observation of data workflow through a Big Data spreadsheet with dynamic charts and easy-to-use advanced analytics, all tightly integrated. A technical cooperation agreement is sought with Big Data solution providers willing to integrate cutting-edge technology to add visual data exploration and analysis functions to their solution.
Description
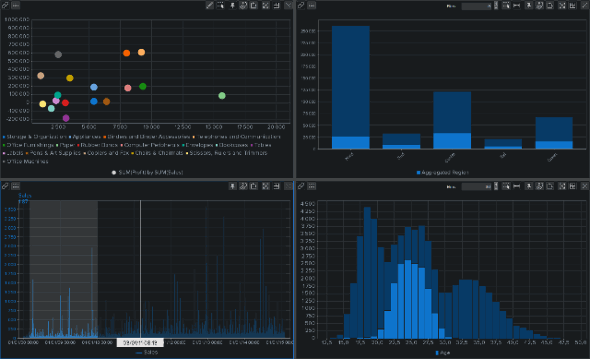
A French Startup specialised in software development has developed a visual analytics software that enables to visualise any data workflow from a Big Data spreadsheet with dynamic charts and easy-to-use advanced analytics. The software provides a unique and highly integrated dynamic interaction, allowing to:

- Visually explore in real time Big Data sets

- Process your data taking into account your complete dataset

- Work with analytics tools by simply drag'n'drop

- Export animated Graphics Interchange Format (gif) images and share them

- Manage time series extraction of data even with accuracy of milliseconds

- Enable "R language" script execution with a bridge (link) to "RServe"

- Connect to a database.

The Startup seeks a partner which has already a software solution and which wants to add these new functionalities to it. The Startup and the partner will sign a technical cooperation agreement, and will give support to its partner, in order to integrate this new functionality to its software solution.
Advantages and Innovations
The dynamic interaction framework is 100% innovative and based on proprietary architecture build from scratch. This includes a in-memory database, a query engine as well as a rendering engine.
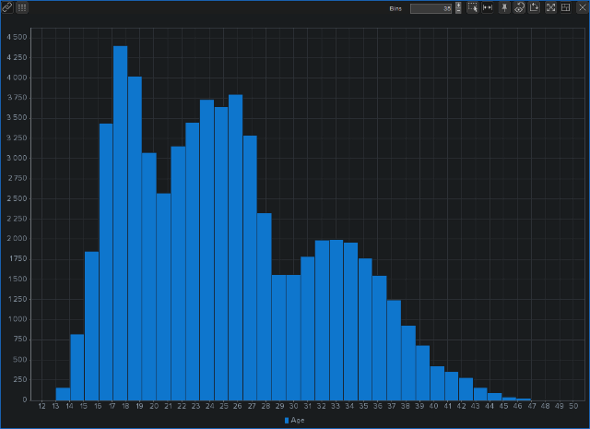
Leveraging its unique architecture, the software enables dynamic linking and brushing, dynamic aggregation and advanced analytics and it provides natural time support with millisecond precision for time-series analysis.
The software lets you display simultaneously and manipulate responsively dozens of millions of data points on a desktop machine.
It helps all data workers involved in finding and making value with their data, whether they are doing exploratory analysis on an unknown dataset, preparing data for another task, or reviewing the latest results of machine learning algorithm...
It allow to :
- Visually explore in real time Big Data sets
- Process your data taking into account your complete dataset
- Work with analytics tools by simply drag'n'drop
- Export animated Graphics Interchange Format (gif) images and share them
- Manage time series extraction of data even with accuracy of milliseconds
- Enable "R language" script execution with a bridge (link) to "RServe"
- Connect to a database.
Stage Of Development
Already on the market
Stage Of Development Comment
The software is already on the market and development continues to integrate use cases.
Requested partner
Big Data solution providers willing to integrate cutting-edge technology to add visual data exploration and analysis functions to their software solution.
Cooperation offer is closed for requests